The Art of Mathematics: A Mandala Maker Tutorial

In front-end development, there’s often a great deal of focus on tools that aim to make our work more efficient. But what if you’re new to web development? When you’re just starting out, the amount of new material can be overwhelming, particularly if you don’t have a solid background in Computer Science. But the truth is, once you’ve learned a little bit of JavaScript, you can already make some pretty impressive things.
A couple of years back, when I was learning to code, I started working on a side project. I wanted to make something colorful and fun to share with my friends. This is what my app looks like these days:

The coolest part about it is the fact that it’s a tool: anyone can use it to create something original and brand new.
In this tutorial, we’ll build a smaller version of this app – a symmetrical drawing tool in ES5, JavaScript and HTML5. The tutorial app will have eight reflections, a color picker and a Clear button. Once we’re done, you’re on your own and can tweak it as you please. Be creative!
Preparations: a blank canvas
The first thing you’ll need for this project is a designated drawing space. We’ll use the HTML5 canvas element and give it a width and a height of 600px (you can set the dimensions to anything else if you like).
Files
Create 3 files: index.html, styles.css, main.js. Don’t forget to include your JS and CSS files in your HTML.
<!DOCTYPE html>
<html>
<head>
    <meta charset="utf-8">
    <link rel="stylesheet" type="text/css" href="style.css">
    <script src="main.js"></script>
</head>
<body onload="init()">
    <canvas width="600" height="600">
        <p>Your browser doesn't support canvas.</p>
    </canvas>
</body>
</html>
I’ll ask you to update your HTML file at a later point, but the CSS file we’ll start with will stay the same throughout the project. This is the full CSS we are going to use:
body {
    background-color: #ccc;
    text-align: center;
}

canvas {
    touch-action: none;
    background-color: #fff;
}

button {
    font-size: 110%;
}
Next steps
We are done with our preparations and ready to move on to the actual tutorial, which is made up of 4 parts:
- Building a simple drawing app with one line and one color
- Adding a Clear button and a color picker
- Adding more functionality: 2 line drawing (add the first reflection)
- Adding more functionality: 8 line drawing (add 6 more reflections!)
Interactive demos
This tutorial will be accompanied by four CodePens, one at the end of each section. In my own app I originally used mouse events, and only added touch events when I realized mobile device support was (A) possible, and (B) going to make my app way more accessible. For the sake of code simplicity, I decided that in this tutorial app I will only use one event type, so I picked a third option: pointer events. These are supported by some desktop browsers and some mobile browsers. An up-to-date version of Chrome is probably your best bet.
Part 1: A simple drawing app
Let’s get started with our main.js file. Our basic drawing app will be made up of 6 functions: init, drawLine, stopDrawing, recordPointerLocation, handlePointerMove, handlePointerDown. It also has nine variables:
var canvas, context, w, h,
    prevX = 0, currX = 0, prevY = 0, currY = 0,
    draw = false;
The variables canvas and context let us manipulate the canvas. w is the canvas width and h is the canvas height. The four coordinates are used for tracking the current and previous location of the pointer. A short line is drawn between (prevX, prevY) and (currX, currY) repeatedly many times while we move the pointer upon the canvas. For your drawing to appear, three conditions must be met: the pointer (be it a finger, a trackpad or a mouse) must be down, it must be moving and the movement has to be on the canvas. If these three conditions are met, the boolean draw is set to true.
1. init
Responsible for canvas set up, this listens to pointer events and the location of their coordinates and sets everything in motion by calling other functions, which in turn handle touch and movement events.
function init() {
    canvas = document.querySelector("canvas");
    context = canvas.getContext("2d");
    w = canvas.width;
    h = canvas.height;

    canvas.onpointermove = handlePointerMove;
    canvas.onpointerdown = handlePointerDown;
    canvas.onpointerup = stopDrawing;
    canvas.onpointerout = stopDrawing;
}
2. drawLine
This is called to action by handlePointerMove() and draws the pointer path. It only runs if draw = true. It uses canvas methods you can read about in the canvas API documentation. You can also learn to use the canvas element in this tutorial.
lineWidth and linecap set the properties of our paint brush, or digital pen, but pay attention to beginPath and closePath. Between those two is where the magic happens: moveTo and lineTo take canvas coordinates as arguments and draw from (a,b) to (c,d), which is to say from (prevX,prevY) to (currX,currY).
function drawLine() {
    var a = prevX,
        b = prevY,
        c = currX,
        d = currY;

    context.lineWidth = 4;
    context.lineCap = "round";

    context.beginPath();
    context.moveTo(a, b);
    context.lineTo(c, d);
    context.stroke();
    context.closePath();
}
3. stopDrawing
This is used by init when the pointer is not down (onpointerup) or is out of bounds (onpointerout).
function stopDrawing() {
    draw = false;
}
4. recordPointerLocation
This tracks the pointer’s location and stores its coordinates. Also, you need to know that in computer graphics the origin of the coordinate space (0,0) is at the top left corner, and all elements are positioned relative to it. When we use canvas we are dealing with two coordinate spaces: the browser window and the canvas itself. This function converts between the two: it subtracts the canvas offsetLeft and offsetTop so we can later treat the canvas as the only coordinate space. If you are confused, read more about it.
function recordPointerLocation(e) {
    prevX = currX;
    prevY = currY;
    currX = e.clientX - canvas.offsetLeft;
    currY = e.clientY - canvas.offsetTop;
}
5. handlePointerMove
This is set by init to run when the pointer moves. It checks if draw = true. If so, it calls recordPointerLocation to get the path and drawLine to draw it.
function handlePointerMove(e) {
    if (draw) {
        recordPointerLocation(e);
        drawLine();
    }
}
6. handlePointerDown
This is set by init to run when the pointer is down (finger is on touchscreen or mouse it clicked). If it is, calls recordPointerLocation to get the path and sets draw to true. That’s because we only want movement events from handlePointerMove to cause drawing if the pointer is down.
function handlePointerDown(e) {
    recordPointerLocation(e);
    draw = true;
}
Finally, we have a working drawing app. But that’s just the beginning!
See the Pen Mandala Maker Tutorial: Part 1 by Hagar Shilo (@hagarsh) on CodePen.
Part 2: Add a Clear button and a color picker
Now we’ll update our HTML file, adding a menu div with an input of the type and class color and a button of the class clear.
<body onload="init()">
    <canvas width="600" height="600">
        <p>Your browser doesn't support canvas.</p>
    </canvas>
    <div class="menu">
        <input type="color" class="color" />
        <button type="button" class="clear">Clear</button>
    </div>
</body>
Color picker
This is our new color picker function. It targets the input element by its class and gets its value.
function getColor() {
    return document.querySelector(".color").value;
}
Up until now, the app used a default color (black) for the paint brush/digital pen. If we want to change the color we need to use the canvas property strokeStyle. We’ll update drawLine by adding strokeStyle to it and setting it to the input value by calling getColor.
function drawLine() {
    //...code...
    context.strokeStyle = getColor();
    context.lineWidth = 4;
    context.lineCap = "round";

    //...code...
}
Clear button
This is our new Clear function. It responds to a button click and displays a dialog asking the user if she really wants to delete the drawing.
function clearCanvas() {
    if (confirm("Want to clear?")) {
        context.clearRect(0, 0, w, h);
    }
}
The method clearRect takes four arguments. The first two (0,0) mark the origin, which is actually the top left corner of the canvas. The other two (w,h) mark the full width and height of the canvas. This means the entire canvas will be erased, from the top left corner to the bottom right corner.
If we were to give clearRect a slightly different set of arguments, say (0,0,w/2,h), the result would be different. In this case, only the left side of the canvas would clear up.
Let’s add this event handler to init:
function init() {
    //...code...
    canvas.onpointermove = handleMouseMove;
    canvas.onpointerdown = handleMouseDown;
    canvas.onpointerup = stopDrawing;
    canvas.onpointerout = stopDrawing;
    document.querySelector(".clear").onclick = clearCanvas;
}
See the Pen Mandala Maker Tutorial: Part 2 by Hagar Shilo (@hagarsh) on CodePen.
Part 3: Draw with 2 lines
It’s time to make a line appear where no pointer has gone before. A ghost line!
For that we are going to need four new coordinates: a', b', c' and d' (marked in the code as a_, b_, c_ and d_). In order for us to be able to add the first reflection, first we must decide if it’s going to go over the y-axis or the x-axis. Since this is an arbitrary decision, it doesn’t matter which one we choose. Let’s go with the x-axis.
Here is a sketch to help you grasp the mathematics of reflecting a point across the x-axis. The coordinate space in my sketch is different from my explanation earlier about the way the coordinate space works in computer graphics (more about that in a bit!).
Now, look at A. It shows a point drawn where the pointer hits, and B shows the additional point we want to appear: a reflection of the point across the x-axis. This is our goal.
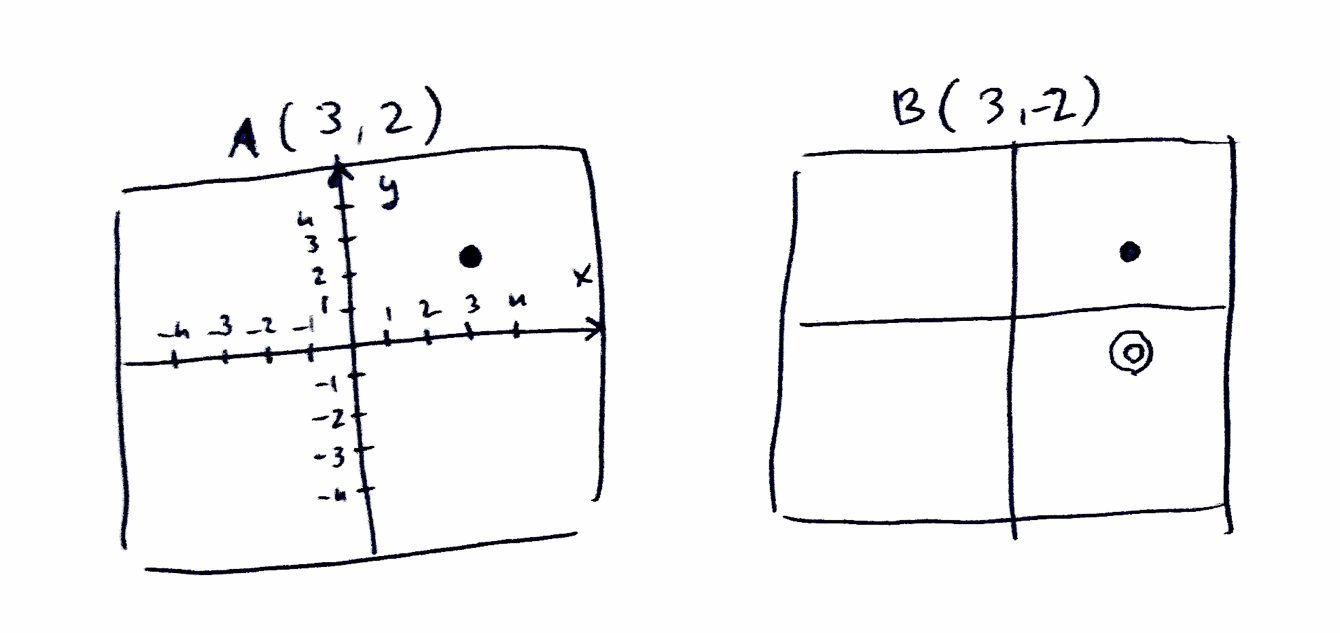
What happens to the x coordinates?
The variables a/a' and c/c' correspond to prevX and currX respectively, so we can call them “the x coordinates”. We are reflecting across x, so their values remain the same, and therefore a' = a and c' = c.
What happens to the y coordinates?
What about b' and d'? Those are the ones that have to change, but in what way? Thanks to the slightly misleading sketch I showed you just now (of A and B), you probably think that the y coordinates b' and d' should get the negative values of b and d respectively, but nope. This is computer graphics, remember? The origin is at the top left corner and not at the canvas center, and therefore we get the following values: b = h - b, d' = h - d, where h is the canvas height.
This is the new code for the app’s variables and the two lines: the one that fills the pointer’s path and the one mirroring it across the x-axis.
function drawLine() {
    var a = prevX, a_ = a,
        b = prevY, b_ = h-b,
        c = currX, c_ = c,
        d = currY, d_ = h-d;

    //... code ...

    // Draw line #1, at the pointer's location
    context.moveTo(a, b);
    context.lineTo(c, d);

    // Draw line #2, mirroring the line #1
    context.moveTo(a_, b_);
    context.lineTo(c_, d_);

    //... code ...
}
In case this was too abstract for you, let’s look at some actual numbers to see how this works.
Let’s say we have a tiny canvas of w = h = 10. Now let a = 3, b = 2, c = 4 and d = 3.
So b' = 10 - 2 = 8 and d' = 10 - 3 = 7.
We use the top and the left as references. For the y coordinates this means we count from the top, and 8 from the top is also 2 from the bottom. Similarly, 7 from the top is 3 from the bottom of the canvas. That’s it, really. This is how the single point, and a line (not necessarily a straight one, by the way) is made up of many, many small segments that are similar to point in behavior.
If you are still confused, I don’t blame you.
Here is the result. Draw something and see what happens.
See the Pen Mandala Maker Tutorial: Part 3 by Hagar Shilo (@hagarsh) on CodePen.
Part 4: Draw with 8 lines
I have made yet another confusing sketch, with points C and D, so you understand what we’re trying to do. Later on we’ll look at points E, F, G and H as well. The circled point is the one we’re adding at each particular step. The circled point at C has the coordinates (-3,2) and the circled point at D has the coordinates (-3,-2). Once again, keep in mind that the origin in the sketches is not the same as the origin of the canvas.
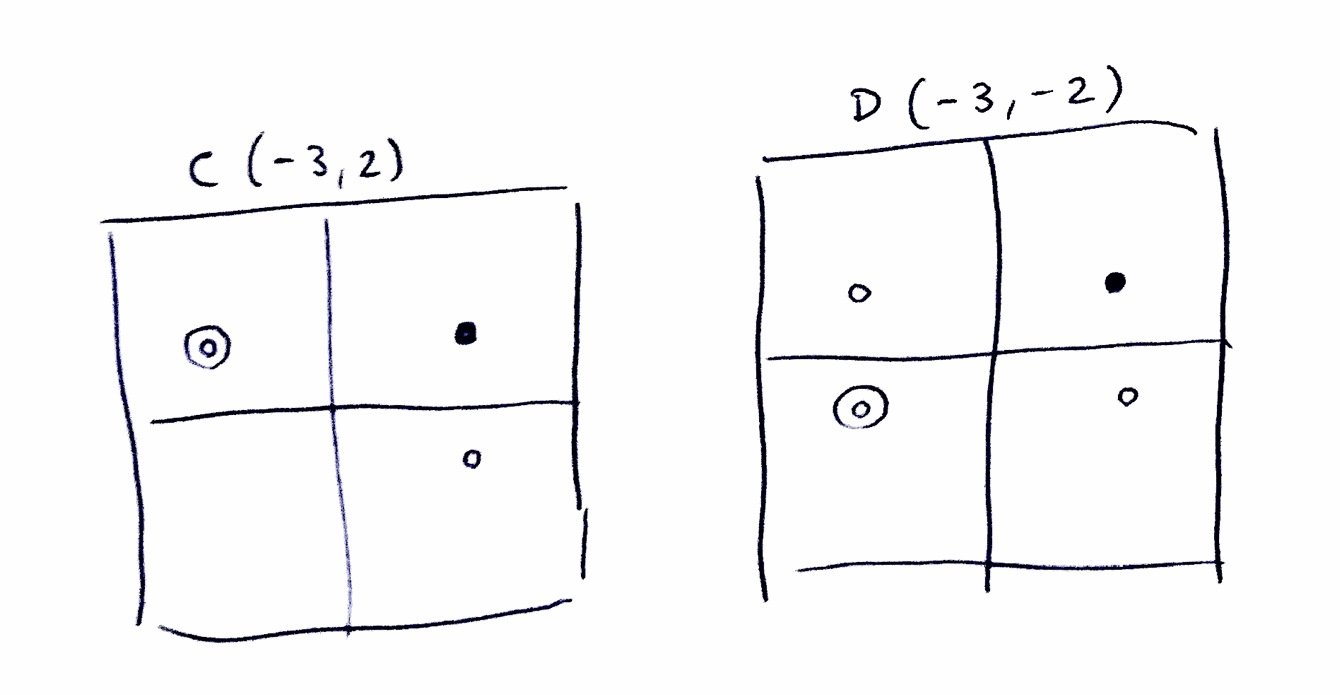
This is the part where the math gets a bit mathier, as our drawLine function evolves further. We’ll keep using the four new coordinates: a', b', c' and d', and reassign their values for each new location/line. Let’s add two more lines in two new locations on the canvas. Their locations relative to the first two lines are exactly what you see in the sketch above, though the calculation required is different (because of the origin points being different).
function drawLine() {

    //... code ...

    // Reassign values
    a_ = w-a; b_ = b;
    c_ = w-c; d_ = d;

    // Draw the 3rd line
    context.moveTo(a_, b_);
    context.lineTo(c_, d_);

    // Reassign values
    a_ = w-a; b_ = h-b;
    c_ = w-c; d_ = h-d;

    // Draw the 4th line
    context.moveTo(a_, b_);
    context.lineTo(c_, d_);

    //... code ...
What is happening?
You might be wondering why we use w and h as separate variables, even though we know they have the same value. Why complicate the code this way for no apparent reason? That’s because we want the symmetry to hold for a rectangular canvas as well, and this way it will.
Also, you may have noticed that the values of a' and c' are not reassigned when the fourth line is created. Why write their value assignments twice? It’s for readability, documentation and communication. Maintaining the quadruple structure in the code is meant to help you remember that all the while we are dealing with two y coordinates (current and previous) and two x coordinates (current and previous).
What happens to the x coordinates?
As you recall, our x coordinates are a (prevX) and c (currX).
For the third line we are adding, a' = w - a and c' = w - c, which means…
For the fourth line, the same thing happens to our x coordinates a and c.
What happens to the y coordinates?
As you recall, our y coordinates are b (prevY) and d (currY).
For the third line we are adding, b' = b and d' = d, which means the y coordinates are the ones not changing this time, making this is a reflection across the y-axis.
For the fourth line, b' = h - b and d' = h - d, which we’ve seen before: that’s a reflection across the x-axis.
We have four more lines, or locations, to define. Note: the part of the code that’s responsible for drawing a micro-line between the newly calculated coordinates is always the same:
    context.moveTo(a_, b_);
    context.lineTo(c_, d_);
We can leave it out of the next code snippets and just focus on the calculations, i.e, the reassignments.
Once again, we need some concrete examples to see where we’re going, so here’s another sketch! The circled point E has the coordinates (2,3) and the circled point F has the coordinates (2,-3). The ability to draw at A but also make the drawing appear at E and F (in addition to B, C and D that we already dealt with) is the functionality we are about to add to out code.
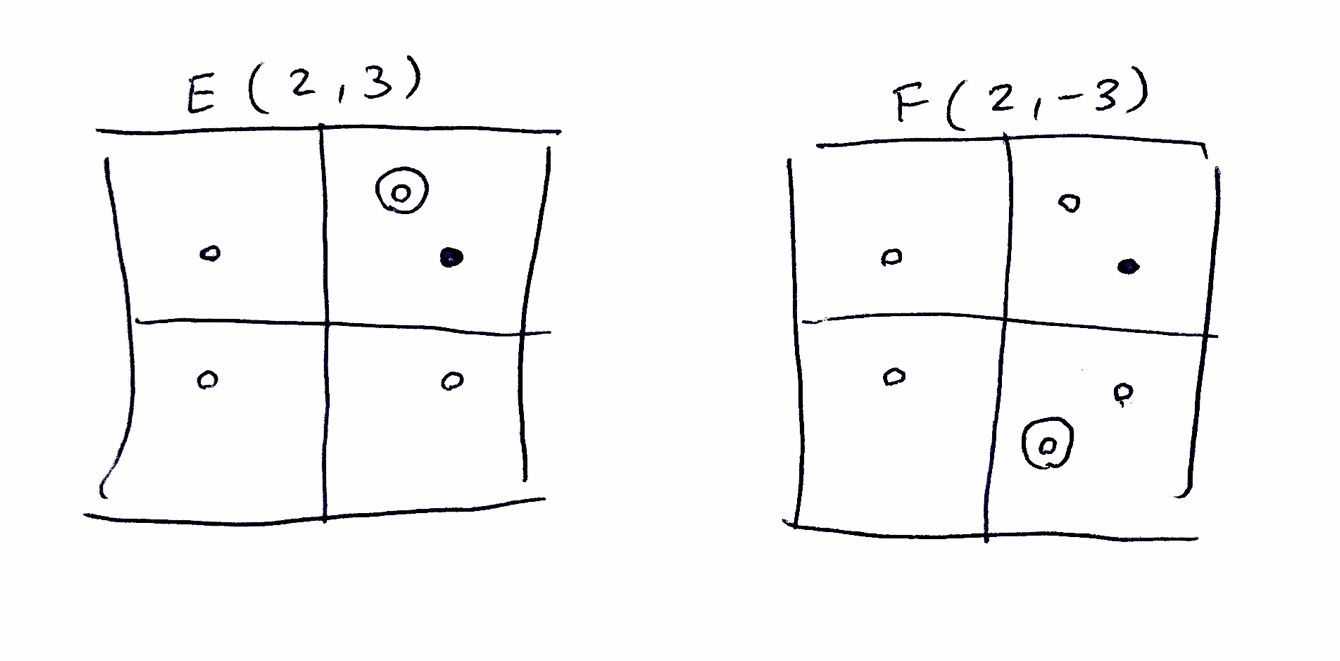
This is the code for E and F:
    // Reassign for 5
    a_ = w/2+h/2-b; b_ = w/2+h/2-a;
    c_ = w/2+h/2-d; d_ = w/2+h/2-c;

    // Reassign for 6
    a_ = w/2+h/2-b; b_ = h/2-w/2+a;
    c_ = w/2+h/2-d; d_ = h/2-w/2+c;
Their x coordinates are identical and their y coordinates are reversed to one another.
This one will be out final sketch. The circled point G has the coordinates (-2,3) and the circled point H has the coordinates (-2,-3).
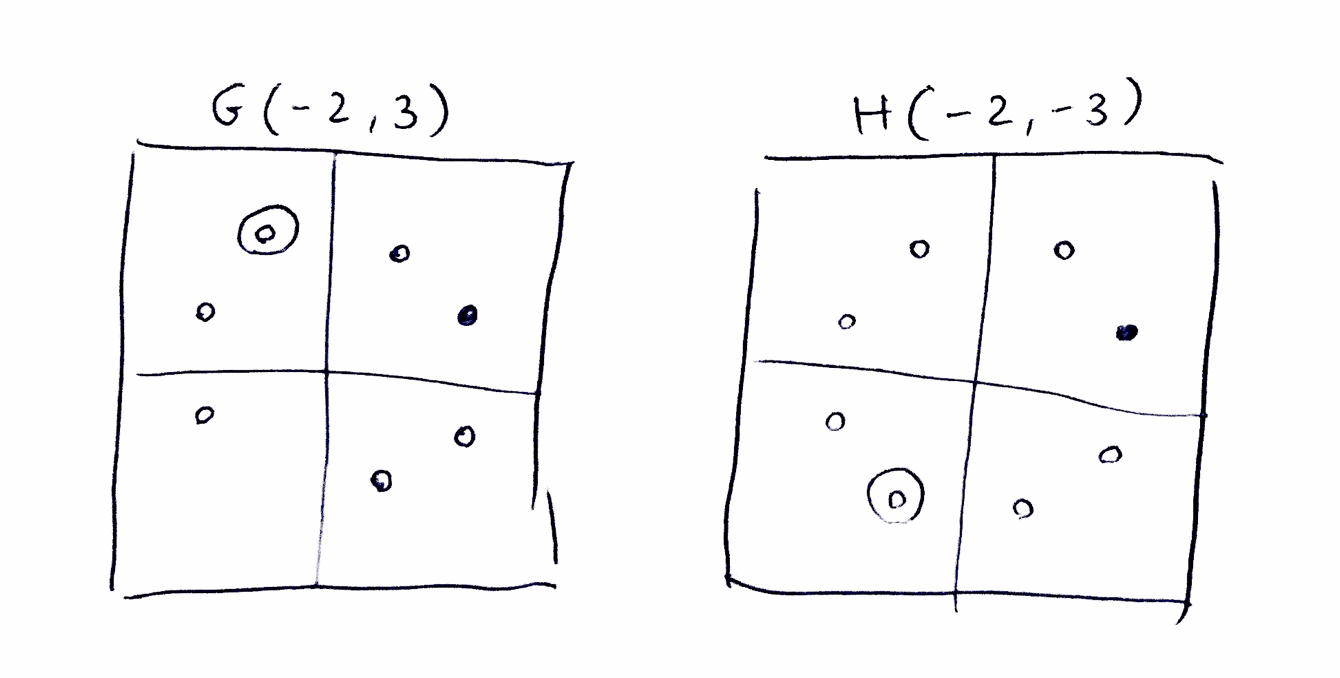
This is the code:
    // Reassign for 7
    a_ = w/2-h/2+b; b_ = w/2+h/2-a;
    c_ = w/2-h/2+d; d_ = w/2+h/2-c;

    // Reassign for 8
    a_ = w/2-h/2+b; b_ = h/2-w/2+a;
    c_ = w/2-h/2+d; d_ = h/2-w/2+c;
    //...code...
}
Once again, the x coordinates of these two points are the same, while the y coordinates are different. And once again I won’t go into the full details, since this has been a long enough journey as it is, and I think we’ve covered all the important principles. But feel free to play around with the code and change it. I really recommend commenting out the code for some of the points to see what your drawing looks like without them.
I hope you had fun learning! This is our final app:
See the Pen Mandala Maker Tutorial: Part 4 by Hagar Shilo (@hagarsh) on CodePen.
About the author
Hagar is a front-end developer and blogger. After nearly a decade in the publishing industry, she transitioned into software development, and today, part of her mission is to help other women who are on this path. She blogs about the tech industry and career switching, and co-admins a Facebook group for women who are taking their first steps into the industry. You can read her musings on her Hebrew blog, Anonymous Function, on Medium, and on TheMarker, where she writes a periodic technology column.
Hagar has always been a person who has many different interests and creative pursuits. Her interests and hobbies include linguistics, sewing, baking, painting and music.
Brought to you by
Related articles
-
Bringing Your Code to the Streets
Ruth John breaks out of the browser and projects a Christmas sound and light show with some JavaScript, the Web MIDI API and a portable A/V pack. Don’t make a spectacle of yourself at the party this year – take it outside!
-
Five Interesting Ways to Use Array.reduce() (And One Boring Way)
Chris Ferdinandi turns the heat down low and lets the sauce reduce while we take a look at how to add spice to our source with a sprinkling of Array.reduce(). Just a little ingenuity with the humblest of functions.
-
Mistletoe Offline
Jeremy Keith reminds us that 4G is king. The carollers sing. One tunnel has passed, a new one’s beginning. Dreams of wi-fi on the go. Fingers numb, smart phones aglow. It’s Christmas time, mistletoe offline. Children streaming their gameplay online. With batteries on fire and gigabytes for free, it’s time to rejoice in connectivity.
-
Taking Device Orientation for a Spin
Drew McLellan wraps up our 2016 season with a look at the HTML5 Device Orientation API and how an annoying physical interaction can become an annoying virtual one. Like the silver sixpence in your figgy pudding, there’s treasure to be found in our browsers, so dig in.
-
Teach the CLI to Talk Back
Anna Debenham sets out to humanise our interactions with the command line to put more of the user into the user interface. Like an injured hedgehog in the winter snow, sometimes we can all benefit from interacting with a human.
-
How Tabs Should Work
Remy Sharp picks that old chestnut – tabs – and roasts it afresh on the open fire of JavaScript to see how a fully navigable, accessible and clickable set of tabs can work. Everybody knows some scripting and some CSS can help to make your website bright. Although it’s been said many times, many ways, please be careful to do it right.