Develop Your Naturalist Superpowers with Observable Notebooks and iNaturalist
We’re going to level up your knowledge of what animals you might see in an area at a particular time of year - a skill every naturalist* strives for - using technology! Using iNaturalist and Observable Notebooks we’re going to prototype seasonality graphs for particular species in an area, and automatically create a guide to what animals you might see in each month.
*(a Naturalist is someone who likes learning about nature, not someone who’s a fan of being naked, that’s a ‘Naturist’… different thing!)
Looking for critters in rocky intertidal habitats
One of my favourite things to do is going rockpooling, or as we call it over here in California, ‘tidepooling’. Amounting to the same thing, it’s going to a beach that has rocks where the tide covers then uncovers little pools of water at different times of the day. All sorts of fun creatures and life can be found in this ‘rocky intertidal habitat’
A particularly exciting creature that lives here is the Nudibranch, a type of super colourful ‘sea slug’. There are over 3000 species of Nudibranch worldwide. (The word “nudibranch” comes from the Latin nudus, naked, and the Greek βρανχια / brankhia, gills.)
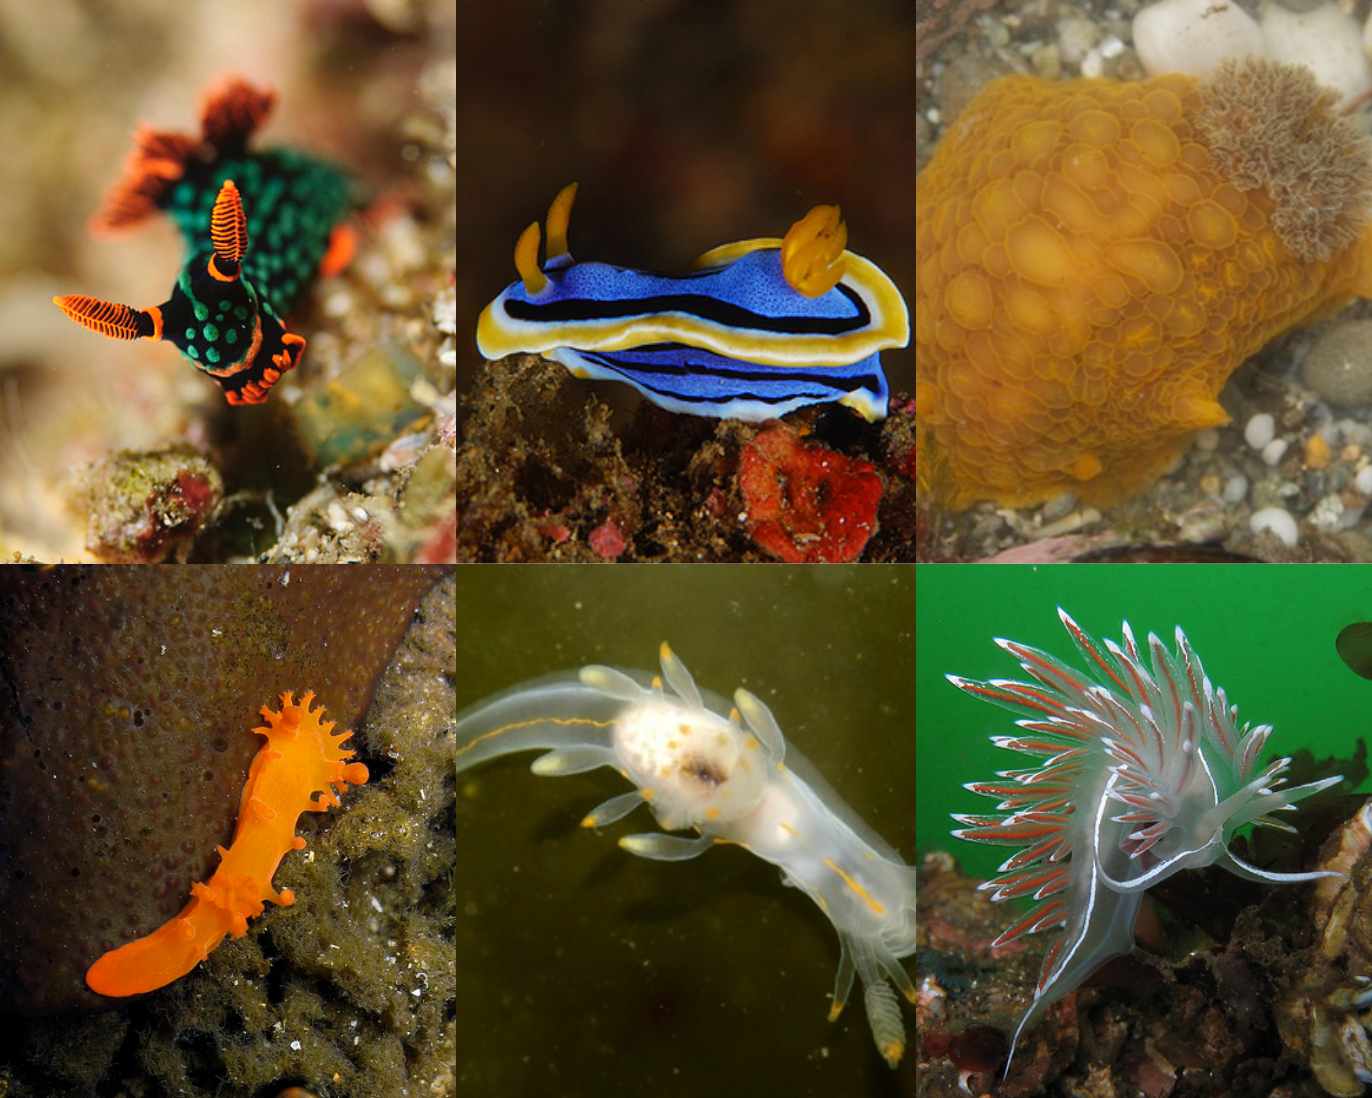
They are however quite tricky to find! Even though they are often brightly coloured and interestingly shaped, some of them are very small, and in our part of the world in the Bay Area in California their appearance in our rockpools is seasonal. We see them more often in Summer months, despite the not-as-low tides as in our Winter and Spring seasons.
My favourite place to go tidepooling here is Pillar Point in Half Moon bay (at other times of the year more famously known for the surf competition ‘Mavericks’). The rockpools there are rich in species diversity, of varied types and water-coverage habitat zones as well as being relatively accessible.
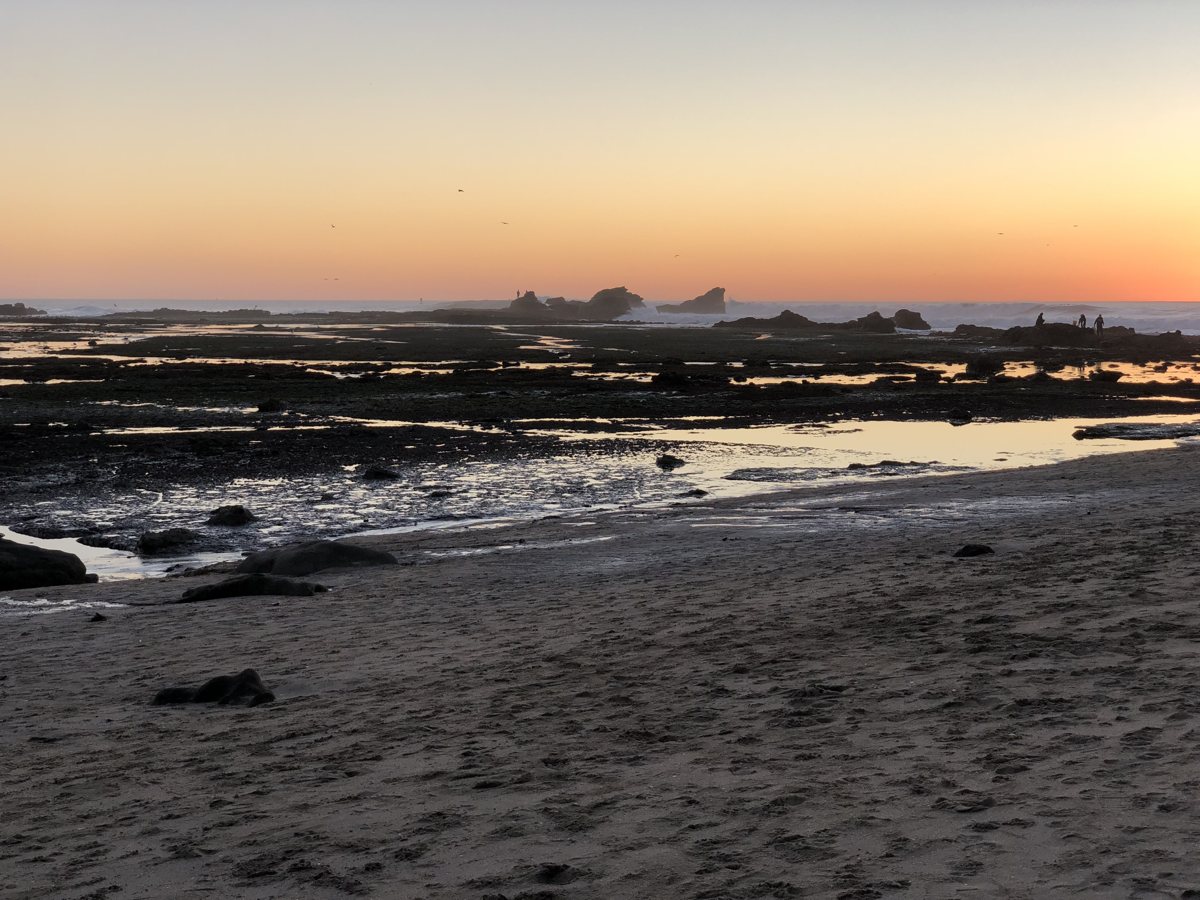
I was rockpooling at Pillar Point recently with my parents and we talked to a lady who remarked that she hadn’t seen any Nudibranchs on her visit this time. I realised that having an idea of what species to find where, and at what time of year is one of the many superpower goals of every budding Naturalist.
Using technology and the croudsourced species observations of the iNaturalist community we can shortcut our way to this superpower!
Finding nearby animals with iNaturalist
We’re going to be getting our information about what animals you can see in Pillar Point using iNaturalist. iNaturalist is a really fun platform that helps connect people to nature and report their findings of life in the outdoors. It is also a community of nature-loving people who help each other identify and confirm those observations. iNaturalist is a project run as a joint initiative by the California Academy of Sciences and the National Geographic Society.
I’ve been using iNaturalist for over two years to record and identify plants and animals that I’ve found in the outdoors. I use their iPhone app to upload my pictures, which then uses machine learning algorithms to make an initial guess at what it is I’ve seen. The community is really active, and I often find someone else has verified or updated my species guess pretty soon after posting.
This process is great because once an observation has been identified by at least two people it becomes ‘verified’ and is considered research grade. Research grade observations get exported and used by scientists, as well as being indexed by the Global Biodiversity Information Facility, GBIF.
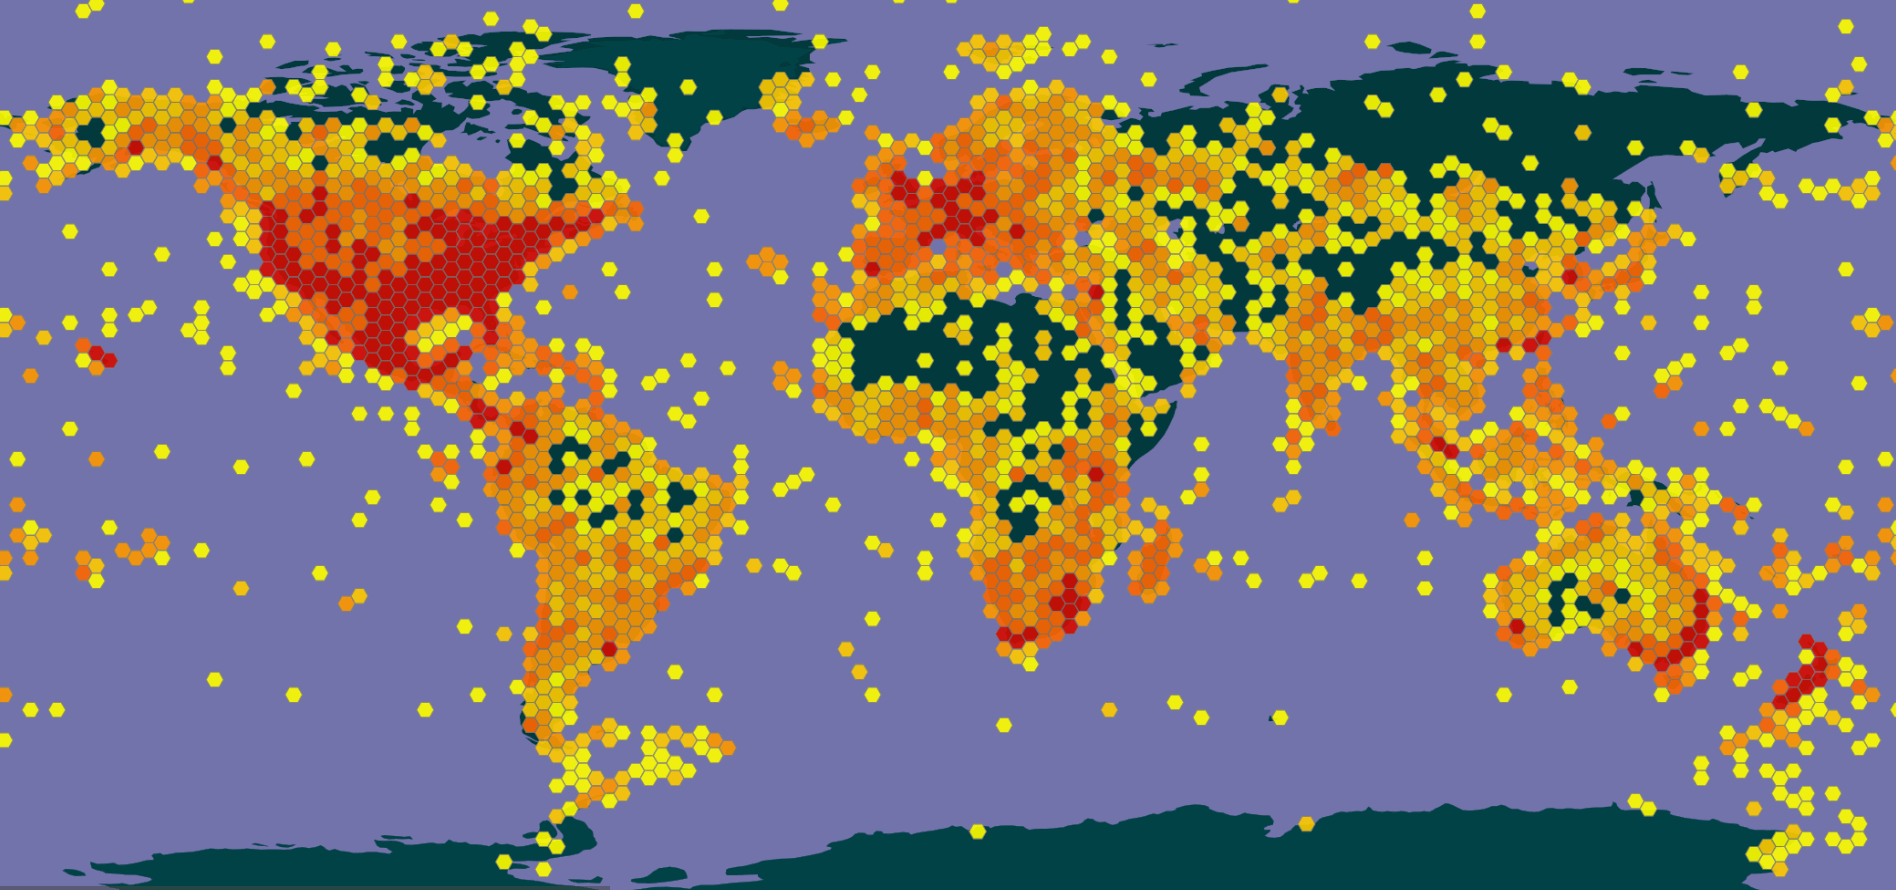
iNaturalist has a great API and API explorer, which makes interacting and prototyping using iNaturalist data really fun. For example, if you go to the API explorer and expand the Observations : Search and fetch section and then the GET /observations API, you get a selection of input boxes that allow you to play with options that you can then pass to the API when you click the ‘Try it out’ button.
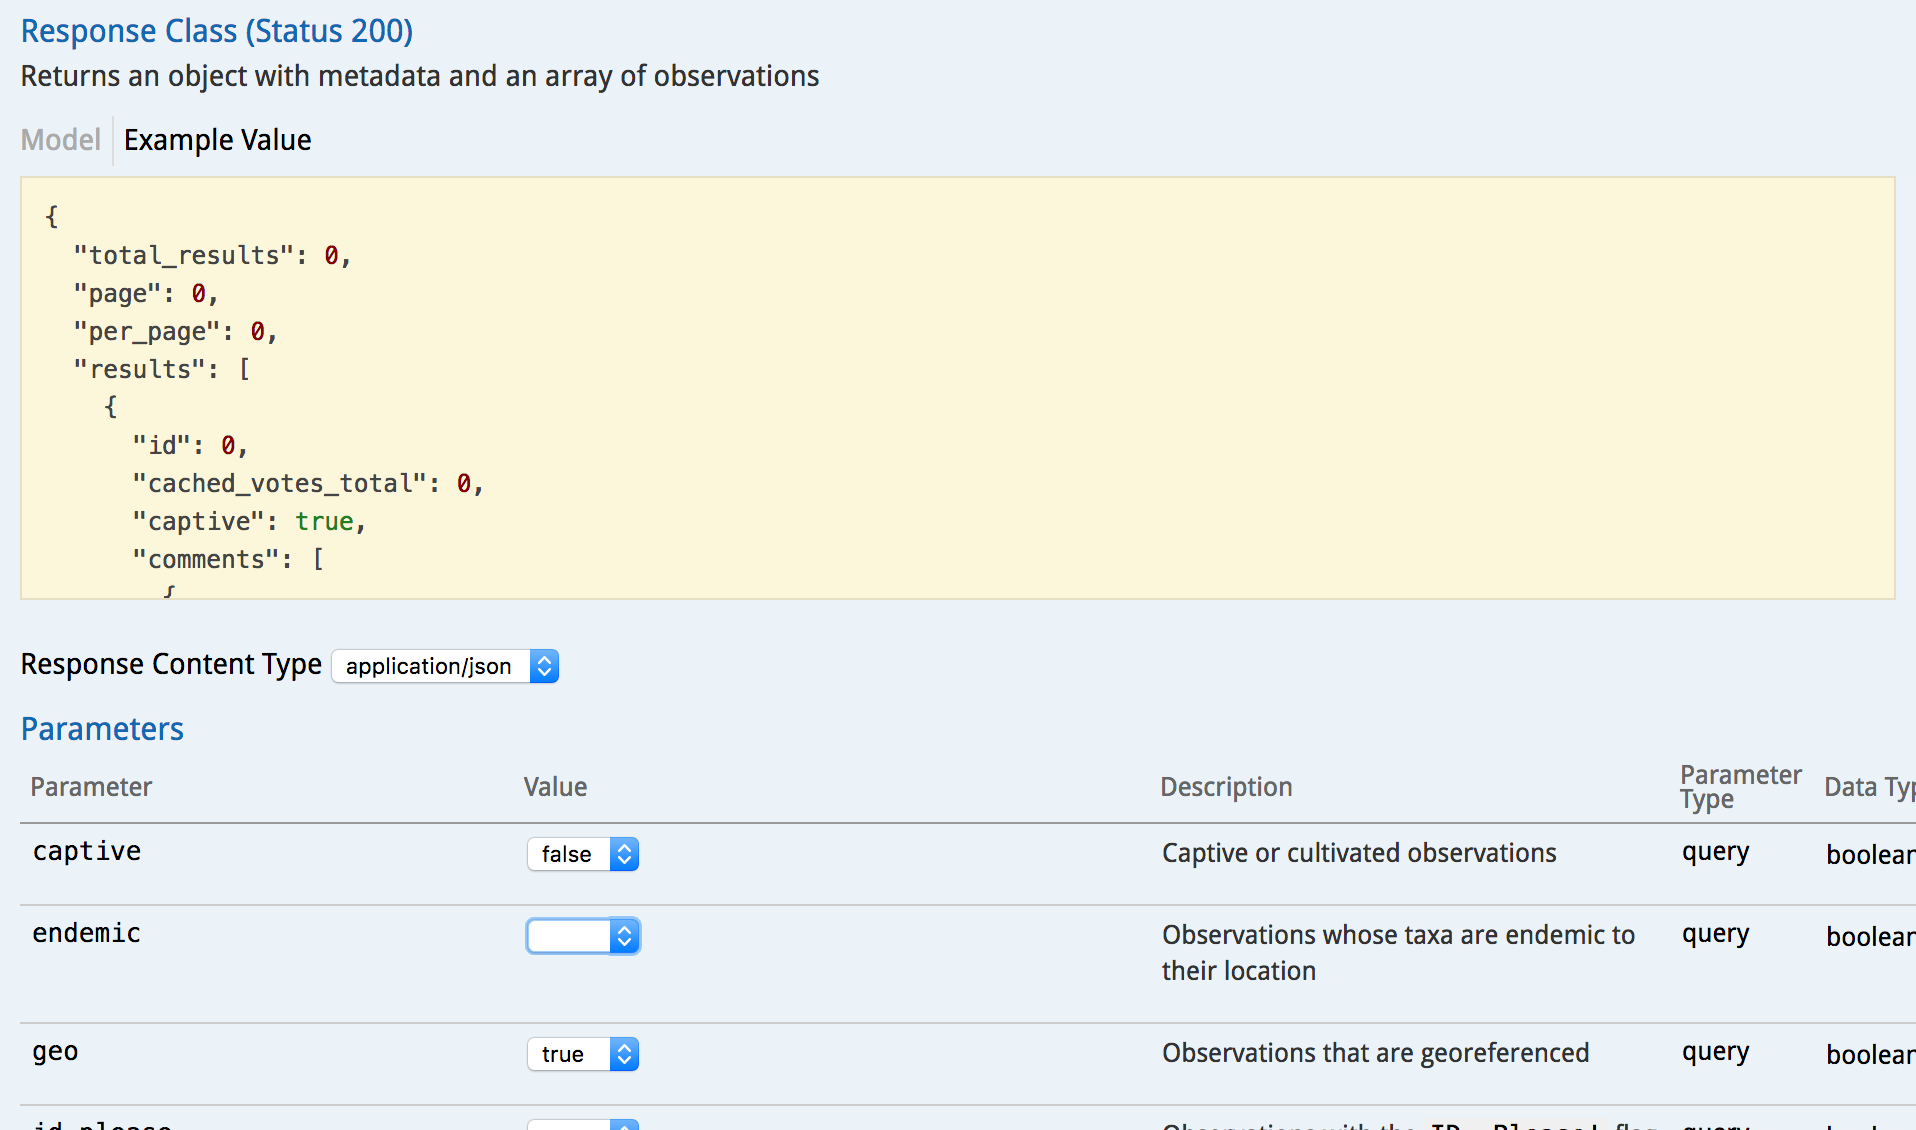
You’ll then get a URL that looks a bit like
https://api.inaturalist.org/v1/observations?captive=false &geo=true&verifiable=true&taxon_id=47113&lat=37.495461&lng=-122.499584 &radius=5&order=desc&order_by=created_at
which you can call and interrrogate using a programming language of your choice.
If you would like to see an all-JavaScript application that uses the iNaturalist API, take a look at OwlsNearMe.com which Simon and I built one weekend earlier this year. It gets your location and shows you all iNaturalist observations of owls near you and lists which species you are likely to see (not adjusted for season).
Rapid development using Observable Notebooks
We’re going to be using Observable Notebooks to prototype our examples, pulling data down from iNaturalist. I really like using visual notebooks like Observable, they are great for learning and building things quickly. You may be familiar with Jupyter notebooks for Python which is similar but takes a bit of setup to get going - I often use these for prototyping too. Observable is amazing for querying and visualising data with JavaScript and since it is a hosted product it doesn’t require any setup at all.
You can follow along and play with this example on my Observable notebook. If you create an account there you can fork my notebook and create your own version of this example.
Each ‘notebook’ consists of a page with a column of ‘cells’, similar to what you get in a spreadsheet. A cell can contain Markdown text or JavaScript code and the output of evaluating the cell appears above the code that generated it. There are lots of tutorials out there on Observable Notebooks, I like this code introduction one from Observable (and D3) creator Mike Bostock.
Developing your Naturalist superpowers
If you have an idea of what plants and critters you might see in a place at the time you visit, you can hone in on what you want to study and train your Naturalist eye to better identify the life around you.
For our example, we care about wildlife we can see at Pillar Point, so we need a way of letting the iNaturalist API know which area we are interested in.
We could use a latitide, longitude and radius for this, but a rectangular bounding box is a better shape for the reef. We can use this tool to draw the area we want to search within: boundingbox.klokantech.com
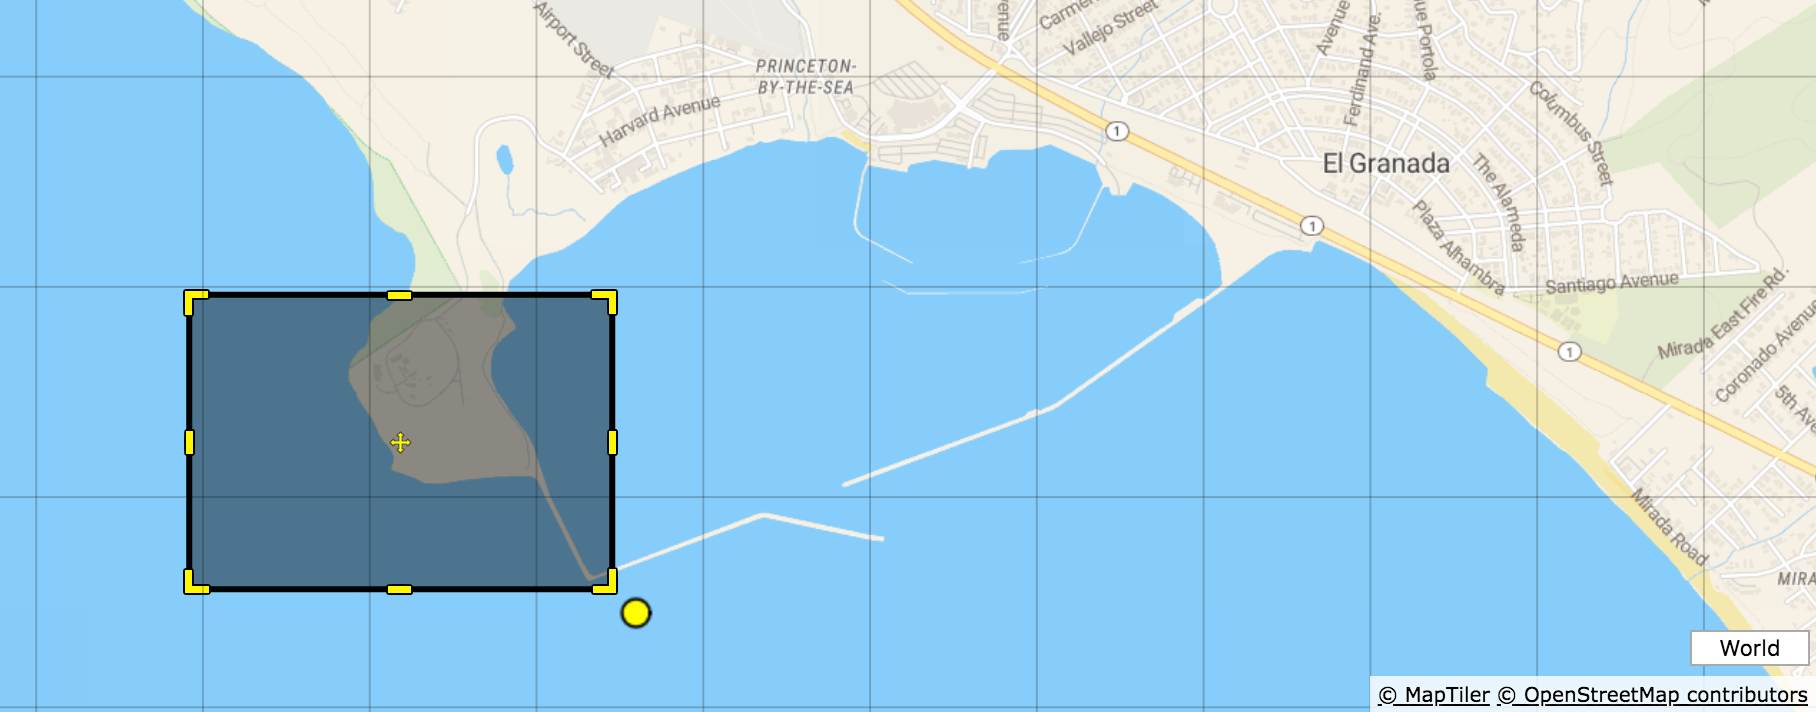
The tool lets you export the bounding box in several forms using the dropdown at the bottom left under the map givese We are going to use the ‘DublinCore’ format as it’s closest to the format needed by the iNaturalist API.
westlimit=-122.50542; southlimit=37.492805; eastlimit=-122.492738; northlimit=37.499811A quick map primer:
The higher the latitude the more north it is
The lower the latitude the more south it is
Latitude 0 = the equator

The higher the longitude the more east it is of Greenwich
The lower the longitude the more west it is of Greenwich
Longitude 0 = Greenwich
In the iNaturalst API we want to use the parameters nelat, nelng, swlat, swlng to create a query that looks inside a bounding box of Pillar Point near Half Moon Bay in California:
nelat = highest latitude = north limit = 37.499811
nelng = highest longitude = east limit = -122.492738
swlat = smallest latitude = south limit = 37.492805
swlng = smallest longitude = west limit = 122.50542
As API parameters these look like this:
?nelat=37.499811&nelng=-122.492738&swlat=37.492805&swlng=122.50542These parameters in this format can be used for most of the iNaturalist API methods.
Nudibranch seasonality in Pillar Point
We can use the iNaturalist observation_histogram API to get a count of Nudibranch observations per week-of-year across all time and within our Pillar Point bounding box.
In addition to the geographic parameters that we just worked out, we are also sending the taxon_id of 47113, which is iNaturalists internal number associated with the Nudibranch taxon. By using this we can get all species which are under the parent ‘Order Nudibranchia’.
Another useful piece of naturalist knowledge is understanding the biological classification scheme of Taxanomic Rank - roughly, when a species has a Latin name of two words eg ‘Glaucus Atlanticus’ the first Latin word is the ‘Genus’ like a family name ‘Glaucus’, and the second word identifies that particular species, like a given name ‘Atlanticus’.
The two Latin words together indicate a specific species, the term we use colloquially to refer to a type of animal often differs wildly region to region, and sometimes the same common name in two countries can refer to two different species. The common names for the Glaucus Atlanticus (which incidentally is my favourite sea slug) include: sea swallow, blue angel, blue glaucus, blue dragon, blue sea slug and blue ocean slug! Because this gets super confusing, Scientists like using this Latin name format instead.
The following piece of code asks the iNaturalist Histogram API to return per-week counts for verified observations of Nudibranchs within our Pillar Point bounding box:
pillar_point_counts_per_week = fetch(
  "https://api.inaturalist.org/v1/observations/histogram?taxon_id=47113&nelat=37.499811&nelng=-122.492738&swlat=37.492805&swlng=-122.50542&date_field=observed&interval=week_of_year&verifiable=true"
  ).then(response => {
  return response.json();
})
Our next step is to take this data and draw a graph! We’ll be using Vega-Lite for this, which is a fab JavaScript graphing libary that is also easy and fun to use with Observable Notebooks.
(Here is a great tutorial on exploring data and drawing graphs with Observable and Vega-Lite)
The iNaturalist API returns data that looks like this:
{
  "total_results": 53,
  "page": 1,
  "per_page": 53,
  "results": {
    "week_of_year": {
      "1": 136,
      "2": 20,
      "3": 150,
      "4": 65,
      "5": 186,
      "6": 74,
      "7": 47,
      "8": 87,
      "9": 64,
      "10": 56,
But for our Vega-Lite graph we need data that looks like this:
[{
  "week": "01",
  "value": 136
}, {
  "week": "02",
  "value": 20
}, ...]
We can convert what we get back from the API to the second format using a loop that iterates over the object keys:
objects_to_plot = {
  let objects = [];
  Object.keys(pillar_point_counts_per_week.results.week_of_year).map(function(week_index) {
    objects.push({
      week: `Wk ${week_index.toString()}`,
      observations: pillar_point_counts_per_week.results.week_of_year[week_index]
    });
  })
  return objects;
}
We can then plug this into Vega-Lite to draw us a graph:
vegalite({
  data: {values: objects_to_plot},
  mark: "bar",
  encoding: {
    x: {field: "week", type: "nominal", sort: null},
    y: {field: "observations", type: "quantitative"}
  },
  width: width * 0.9
})
It’s worth noting that we have a lot of observations of Nudibranchs particularly at Pillar Point due in no small part to the intertidal monitoring research that Alison Young and Rebecca Johnson facilitate for the California Achademy of Sciences.
So, what if we want to look for the seasonality of observations of a particular species of adorable sea slug? We want our interface to have a select box with a list of all the species you might find at any time of year. We can do this using the species_counts API to create us an object with the iNaturalist species ID and common & Latin names.
pillar_point_nudibranches = {
  let api_results = await fetch(
  "https://api.inaturalist.org/v1/observations/species_counts?taxon_id=47113&nelat=37.499811&nelng=-122.492738&swlat=37.492805&swlng=-122.50542&date_field=observed&verifiable=true"
  ).then(r => r.json())

  let species_list = api_results.results.map(i => ({
      value: i.taxon.id,
      label: `${i.taxon.preferred_common_name} (${i.taxon.name})`
  }));

  return species_list
}
We can create an interactive select box by importing code from Jeremy Ashkanas’ Observable Notebook: add import {select} from "@jashkenas/inputs" to a cell anywhere in our notebook. Observable is magic: like a spreadsheet, the order of the cells doesn’t matter - if one cell is referenced by any other cell then when that cell updates all the other cells refresh themselves. You can also import and reference one notebook from another!
viewof select_species = select({
    title: "Which Nudibranch do you want to see seasonality for?",
    options: [{value: "", label: "All the Nudibranchs!"}, ...pillar_point_nudibranches],
    value: ""
})
Then we go back to our old favourite, the histogram API just like before, only this time we are calling it with the value created by our select box ${select_species} as taxon_id instead of the number 47113.
pillar_point_counts_per_month_per_species = fetch(
  `https://api.inaturalist.org/v1/observations/histogram?taxon_id=${select_species}&nelat=37.499811&nelng=-122.492738&swlat=37.492805&swlng=-122.50542&date_field=observed&interval=month_of_year&verifiable=true`
).then(r => r.json())
Now for the fun graph bit! As we did before, we re-format the result of the API into a format compatible with Vega-Lite:
objects_to_plot_species_month = {
  let objects = [];
  Object.keys(pillar_point_counts_per_month_per_species.results.month_of_year).map(function(month_index) {
    objects.push({
      month: (new Date(2018, (month_index - 1), 1)).toLocaleString("en", {month: "long"}),
      observations: pillar_point_counts_per_month_per_species.results.month_of_year[month_index]
    });
  })
  return objects;
}
(Note that in the above code we are creating a date object with our specific month in, and using toLocalString() to get the longer English name for the month. Because the JavaScript Date object counts January as 0, we use month_index -1 to get the correct month)
And we draw the graph as we did before, only now if you interact with the select box in Observable the graph will dynamically update!
vegalite({
  data: {values: objects_to_plot_species_month},
  mark: "bar",
  encoding: {
    x: {field: "month", type: "nominal", sort:null},
    y: {field: "observations", type: "quantitative"}
  },
  width: width * 0.9
})
Now we can see when is the best time of year to plan to go tidepooling in Pillar Point if we want to find a specific species of Nudibranch.
This tool is great for planning when we to go rockpooling at Pillar Point, but what about if you are going this month and want to pre-train your eye with what to look for in order to impress your friends with your knowledge of Nudibranchs?
Well… we can create ourselves a dynamic guide that you can with a list of the species, their photo, name and how many times they have been observed in that month of the year!
Our select box this time looks as follows, simpler than before but assigning the month value to the variable selected_month.
viewof selected_month = select({
    title: "When do you want to see Nudibranchs?",
    options: [
      { label: "Whenever", value: "" },
      { label: "January", value: "1" },
      { label: "February", value: "2" },
      { label: "March", value: "3" },
      { label: "April", value: "4" },
      { label: "May", value: "5" },
      { label: "June", value: "6" },
      { label: "July", value: "7" },
      { label: "August", value: "8" },
      { label: "September", value: "9" },
      { label: "October", value: "10" },
      { label: "November", value: "11" },
      { label: "December", value: "12" },
    ],
    value: ""
 })
We then can use the species_counts API to get all the relevant information about which species we can see in month=${selected_month}. We’ll be able to reference this response object and its values later with the variable we just created, eg: all_species_data.results[0].taxon.name.
all_species_data = fetch(
    `https://api.inaturalist.org/v1/observations/species_counts?taxon_id=47113&month=${selected_month}&nelat=37.499811&nelng=-122.492738&swlat=37.492805&swlng=-122.50542&verifiable=true`
).then(r => r.json())
You can render HTML directly in a notebook cell using Observable’s html tagged template literal:
<style>
.collection { margin-top: 2em }
.collection .species { display: inline-block; width: 9em; margin-bottom: 2em; }
.collection .species-name { font-size: 1em; margin: 0; padding: 0 }
.collection .species-count { margin: 0 0 0.3em 0; padding: 0; font-size: 0.75em; color: #999; font-style: italic; }
.collection img { display: block; width: 100% }
.collection select { font-size: 1.5em; }
</style>

<h2>If you go to Pillar Point ${
  {"": "",
   "1":"in January",
   "2":"in Febrary",
   "3":"in March",
   "4":"in April",
   "5":"in May",
   "6":"in June",
   "7":"in July",
   "8":"in August",
   "9":"in September",
   "10":"in October",
   "11":"in November",
   "12":"in December",
  }[selected_month]
 } you might see…</h2>

<div class="collection">
${all_species_data.results.map(s => `<div class="species"><h3 class="species-name">${s.taxon.name}</h3>
  <p class="species-count">Seen ${s.count} times</p>
  <img src="${s.taxon.default_photo.medium_url}"></div>
`)}
</div>
These few lines of HTML are all you need to get this exciting dynamic guide to what Nudibranchs you will see in each month!
Play with it yourself in this Observable Notebook.
Conclusion
I hope by playing with these examples you have an idea of how powerful it can be to prototype using Observable Notebooks and how you can use the incredible crowdsourced community data and APIs from iNaturalist to augment your naturalist skills and impress your friends with your new ‘knowledge of nature’ superpower.
Lastly I strongly encourage you to get outside on a low tide to explore your local rocky intertidal habitat, and all the amazing critters that live there.
Here is a great introduction video to tidepooling / rockpooling, by Rebecca Johnson and Alison Young from the California Academy of Sciences.
About the author
Natalie Downe is a Brit living in the Californian sunshine. Her professional experience spans both software engineering and natural history.
After getting a degree in Computer Information Systems from Bath University, she worked with the British Trust for Conservation Volunteers and the Devon Wildlife Trust, then as frontend engineer for Torchbox and Clearleft.
Then whilst travelling the world with her husband Simon Willison, together created Lanyrd which they ran for 3 years and sold to Eventbrite. Natalie transitioned to Director of Frontend Engineering at Eventbrite. In moving herself, her family and her team over to San Francisco, California, Natalie learned more than she wanted to about government buracracy.
Nowadays Natalie works for herself combining her love of nature and web development, occasionally doing public speaking on CSS or Bats (though not at the same time), volunteering for the California Bat Working group, the Marine Mammal Center and assisting the California Acadamy of Science with their tidepool monitoring.
On Sunny days Natalie can be found hiking around the bay area with her husband and her dog Cleo. On rainy days she mostly eats chocolate.


