Debugging CSS with the DOM Inspector

An Inspector Calls
The larger your site and your CSS becomes, the more likely that you will run into bizarre, inexplicable problems. Why does that heading have all that extra padding? Why is my text the wrong colour? Why does my navigation have a large moose dressed as Noel Coward on top of all the links?
Perhaps you work in a collaborative environment, where developers and other designers are adding code? In which case, the likelihood of CSS strangeness is higher.
You need to debug. You need Firefox’s wise-guy know-it-all, the DOM Inspector.
The DOM Inspector knows where everything is in your layout, and more importantly, what causes it to look the way it does. So without further ado, load up any css based site in your copy of Firefox (or Flock for that matter), and launch the DOM Inspector from the Tools menu.
The inspector uses two main panels – the left to show the DOM tree of the page, and the right to show you detail:
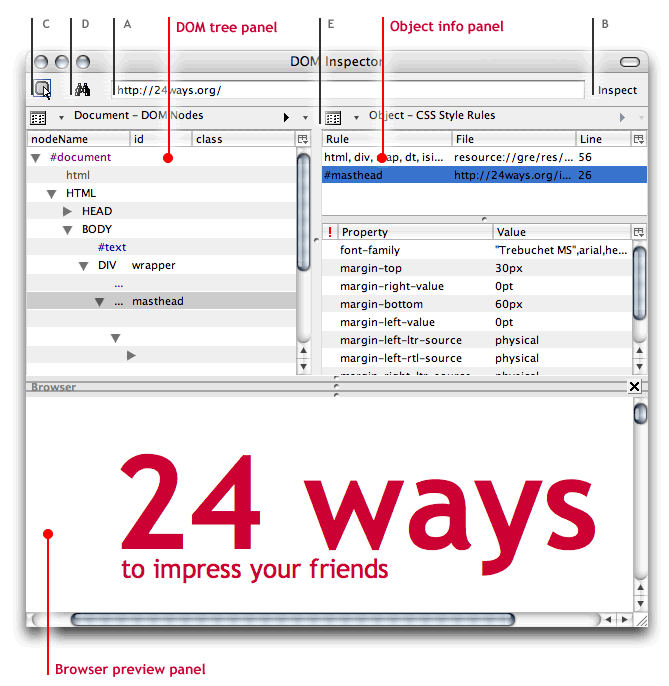
The Inspector will look at whatever site is in the front-most window or tab, but you can also use it without another window. Type in a URL at the top (A), press ‘Inspect’ (B) and a third panel appears at the bottom, with the browser view. I find this layout handier than looking at a window behind the DOM Inspector.
Step 1 – find your node!
Each element on your page – be it a HTML tag or a piece of text, is called a ‘node’ of the DOM tree. These nodes are all listed in the left hand panel, with any ID or CLASS attribute values next to them. When you first look at a page, you won’t see all those yet. Nested HTML elements (such as a link inside a paragraph) have a reveal triangle next to their name, clicking this takes you one level further down.
This can be fine for finding the node you want to look at, but there are easier ways. Say you have a complex rounded box technique that involves 6 nested DIVs? You’d soon get tired of clicking all those triangles to find the element you want to inspect. Click the top left icon © – “Find a node to inspect by clicking on it” and then select the area you want to inspect. Boom! All that drilling down the DOM tree has been done for you! Huzzah!
If you’re looking for an element that you know has an ID (such as <ul id="navigation">), or a specific HTML tag or attribute, click the binoculars icon (D) for “Finds a node to inspect by ID, tag or attribute” (You can also use Ctrl-F or Apple-F to do this if the DOM Inspector is the frontmost window) :
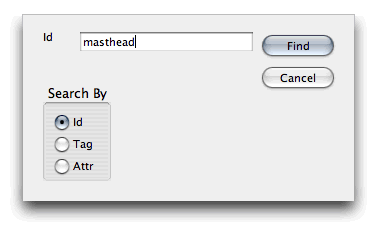
Type in the name and Bam! You’re there! Pressing F3 will take you to any other instances. Notice also, that when you click on a node in the inspector, it highlights where it is in the browser view with a flashing red border!
Now that we’ve found the troublesome node on the page, we can find out what’s up with it…
Step 2 – Debug that node!
Once the node is selected, we move over to the right hand panel. Choose ‘CSS Style Rules’ from the document menu (E), and all the CSS rules that apply to that node are revealed, in the order that they load:
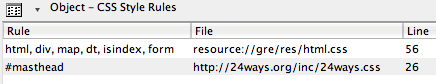
You’ll notice that right at the top, there is a CSS file you might not recognise, with a file path beginning with “resource://”. This is the browsers default CSS, that creates the basic rendering. You can mostly ignore this, especially if use the star selector method of resetting default browser styles.
Your style sheets come next. See how helpful it is? It even tells you the line number where to find the related CSS rules! If you use CSS shorthand, you’ll notice that the values are split up (e.g margin-left, margin-right etc.).
Now that you can see all the style rules affecting that node, the rest is up to you! Happy debugging!
About the author
Jon Hicks is one half of the creative partnership Hicksdesign, designing for a variety of mediums, but with a particular fondness for icon and logo design. In fact he’s written a book, about it called The Icon Handbook, released in January 2012. His recent clients include Skype, Mailchimp, Shopify and Opera Software, but is best known for his uncanny impression of Lucius Malfoy singing “I only want to be with you”.
He blogs about design and personal interests (mainly Dr Who and Cycling) at hicksdesign.co.uk/journal
Brought to you by
Related articles
-
A History of CSS Through Fifteen Years of 24 ways
Rachel Andrew guides us through a tour of the last fifteen years in CSS layout, as manifested in articles here on 24 ways. From the days when Internet Explorer 6 was de rigueur, right up to the modern age of evergreen browsers, the only thing you can be sure of is that the web never stands still for long.
-
A Modern Typographic Scale
Rob Weychert reaches for the top notes to sing us a song of typographic scale. A little attention to scale and to the mathematics will help you to hit a high note with your designs this Christmas and beyond.
-
Beautiful Scrolling Experiences – Without Libraries
Michelle Barker appears as one of a heavenly host, coming forth with scroll in hand to pronounce an end to janky scrolljacking! Unto us a new specification is born, in the city of TimBL, and its name shall be called Scroll Snap.
-
Cascading Web Design with Feature Queries
Chen Hui Jing pulls off the dust covers, swings open the storm shutters and lets the winter light fall on the subject of CSS feature queries. The chestnuts may not yet be roasting, and the halls may be still be undecked, but pull up a chair and settle down. It’s Christmas.
-
Clip Paths Know No Bounds
Dan Wilson throws some Christmas shapes and gives us a run down of different ways to use CSS polygon clip paths to create interesting a flexible shapes with less code that you might have thought. It may be the time of year to follow a star, but was the star plotted with five or ten points?
-
Flexible Captioned Slanted Images
Eric Meyer gift wraps the most awkwardly shaped of boxes using nothing but CSS, HTML and a little curl of ribbon. No matter how well you plan and how much paper you have at your disposal, sometimes you just need to slant the gift to the side.