Data-driven Design with an Annual Survey

Too often, we base designs on assumptions that don’t match customer perspectives. Why? Because the data we need to make informed decisions isn’t available.
Imagine starting off the year with a treasure trove of user data that can be filtered, sliced, and diced to inform new UI designs, help you discover where users struggle the most, and expose emerging trends in your customers’ needs that could lead to new features. Why, that would be useful indeed. And it’s easy to obtain by conducting an annual survey.
Annual surveys may seem as exciting as receiving socks and undies for Christmas, but they’re the gift that keeps on giving all year long (just like fresh socks and undies). I’m not ashamed to admit it: I love surveys! Each time my design research team runs a survey, we learn so much about customer motivations, interests, and behaviors.
Surveys provide an aggregate snapshot of your users that can’t easily be obtained by other research methods, and they can be conducted quickly too. You can build a survey in a few hours, run a pilot test in a day, and have real results streaming in the following day. Speed is essential if design research is going to keep pace with a busy product release schedule.
Surveys are also an invaluable springboard for customer interviews, which provide deep perspectives on user behavior. If you play your cards right as you construct your survey, you can capture a user ID and an email address for each respondent, making it easy to get in touch with customers whose feedback is particularly intriguing. No more recruiting customers for your research via Twitter or through a recruiting company charging a small fortune. You can filter survey responses and isolate the exact customers to talk with in moments, not months.
I love this connected process of sending targeted surveys, filtering the results, and then — with surgical precision — selecting just the right customers to interview. Not only is it fast and cheap, but it lets design researchers do quantitative and qualitative research in a coordinated way. Aggregate survey responses help you quantify the perspectives of different user segments, and interviews help you get into the heads of your customers.
An annual survey can give your team the data needed to make more informed designs in the new year. It all starts with a plan.
Planning your survey
Before you start jotting down questions to ask users, spend some time thinking about the work your team will be doing in the coming year. Are you planning new mobile apps or a responsive redesign? Then questions about devices used and behaviors around mobile devices might be in order. Rethinking your content strategy? Then you might want to ask a few questions about how your customers consume content.
You can’t predict all of the projects you’ll be working on in the coming year, but tuck a couple of sections in your survey about the projects you’re certain about. This will give you the research you need to start new projects with solid foundational data.
Google Drive is a great place to start collaboratively building survey questions with colleagues. Questions that seem crystal clear in your head get challenged, refined, or even expanded quickly when the entire team can chime in.
As you craft your survey, try to consider how you’ll filter it once all of the data is compiled. Do you need to see responses by industry, by age of an account, by devices used, or by size of company? Adding the right filter questions can help you discover fascinating patterns in user segments. Filtering on responses to a few questions can surface insights like: customers in non-profit companies with more than 100 employees are 17% more likely to use an Android phone and are most attracted to features A, D, and F. A designer working on the landing page for a non-profit would love to have concrete information like this. Filter questions are key, so consider them carefully. But don’t go overboard — too many of them and you’ll start to hurt your survey response rate.
Multiple choice questions are the heart of most surveys because respondents can complete them quickly, which increases response rate, and researchers can analyze them without a lot of manual categorization. Open text field questions are valuable too, but be careful not to add too many to your survey. You’ll hate yourself after the survey’s done and you have to sort through and tag thousands of open responses so patterns become visible. Oy vey!
An open-ended question works well towards the end of the survey. At this point respondents have a lot of topics swirling around in their head and tend to say weird things that will pique your interest. This is where you’ll find the outliers who are using your product. They’ll be fascinating to interview, and on occasion will help you see your work in a brand new way.
Conclude your survey with a question asking permission to get in touch for a followup interview so you don’t pester people who want to be left alone.
With your questions nailed down, it’s time to build out that survey and get it ready for sending!
Building your survey
There are dozens of apps you could use to build your survey, but SurveyMonkey is the one that I prefer. It lets you pass in variables for each respondent such as user ID and email address. Metadata about respondents is essential if you’re going to do any follow-up interviews with your customers in the coming year. SurveyMonkey also makes it easy to set up question logic, showing questions to customers only if they responded in a certain way to a prior question. This helps you avoid asking irrelevant questions to some respondents.
Determining survey recipients
Once you’ve chosen a survey tool and entered all of your questions, you need to gather a list of recipients. Your first instinct will be to send it to everyone. You might say, “I need maximum response and metric shit tons of data!” But this is rarely the best approach — broad distribution almost always leads to lower response rates, increased noise, and decreased signal in your data. Are there subsets of customers you could send to, like only those who are active, those who are paying, or have been with you for a certain length of time? Talk to the keepers of your customer database and see how they can segment it so you can be certain you’re talking to just the people who will have the most relevant responses for your needs.
If you want to get super nerdy when finding the right customer sample to survey, use a [sample size calculator]. Sampling is a deep subject best explored in other articles.
Crafting your survey email
After focusing your energies on writing and building your survey, the email asking your customers to respond seems almost trivial, but it will greatly influence your response rate. Take great care when writing your subject line and the body of the email. If you can pull it off, A/B testing subject lines can greatly improve the open rate of your email and click-through to your survey. My design research team has seen a ~10% increase in open and click rates when we A/B tested. We’ve found that personalizing subject lines and greetings with the recipients name (ie. “Hey, Aarron. How can we make our app work better for you?”) gave us the best response rates. Your mileage may vary.
The tone of your email is important — be friendly, honest, and to the point. Those that are passionate about your product will be happy to share their perspective. Writing a survey email that people will actually respond to ain’t easy — in fact, they’re almost always annoying. But Ben Chestnut found a non-annoying way to send a survey email and improve response rates.
The link to your survey should be a clear call to action. A big button with a label like “Answer a few questions” generally does the trick. The URL linking to the survey will need to include some variables like user ID and email. It might look something like this if you’re using SurveyMonkey:
http://surveymonkey.com/s/somesurveyid/?uid=*|UID|*&email=*|email|*As each email is sent, the proper data will be populated in the variables, passing it on to the survey app for inclusion in each response. This is the magic that will help you pinpoint customers to interview down the road, so take special care to test that all is working before sending to all recipients. How you construct the survey link will vary depending on what survey tool and email service provider you use, so don’t take my example as gospel. You’ll need to read the documentation for your survey and email apps to set things up properly.
Pilot before sending
By now, you’ve whipped yourself into a fever pitch over your brilliant survey and the data you hope to collect. Your finger is on the send button, poised for action, but there’s one very important thing to do before you send to the entire list of customers: send a pilot email. How do you know if your questions are clear, your form logic is sound, and you’re passing variables from the email to the survey properly? You won’t, unless you send to a small segment of your recipients first.
The data collected in your pilot will make plain where your survey needs refinement. This data won’t be used in your final analysis, as you’re probably going to make a few changes to your questions.
Send the pilot survey to enough people that you can really stress test the clarity of the questions and data you’re gathering, while considering how much data can you comfortably throw out. If you’re sending your final survey to a few thousand people, you might find a couple of hundred recipients for your pilot will give you enough insight into what to improve while leaving the vast majority of the recipients for your final survey.
After you’ve sent your pilot, made your survey adjustments, and ensured the variables are being passed from your email into the survey app, you’re ready to send to the remainder of your customers. This is your moment of glory!
Analyzing your results
After a couple of weeks you can probably safely close the survey so no other responses come in as you transition from data gathering to data analysis. Any survey app worth its salt will chart responses to your multiple choice questions. Reviewing these charts is a great place to start your analysis. Is there anything particularly interesting that stands out? Jot down some of your observations. I like to print screenshots of the charts for each question, highlighting areas of interest. These prints become a particularly handy reference point for the next step in your analysis.
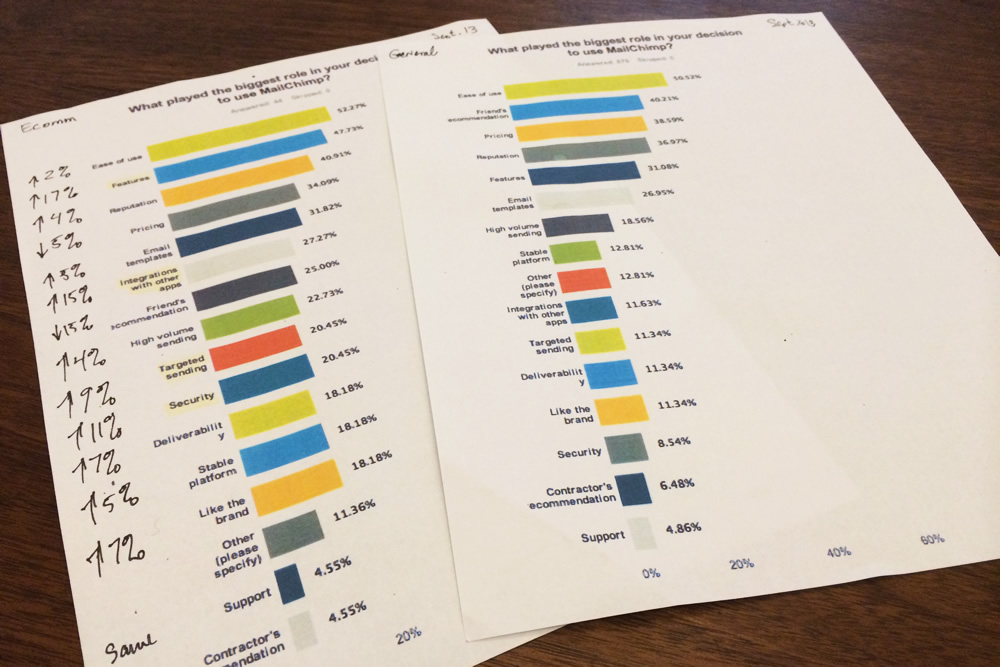
Viewing aggregate data about all responses is interesting, but the deltas between different types of customers are where the real revelations happen. Remember those filter questions you added to your survey? They’re the tool that’ll help you compare customer segments.
Most survey apps will let you filter the data based on response to a question. If the one you’re using doesn’t, you can always export your data and create pivot tables in Excel. Try filtering your data based on one of your filter questions, such as industry, company size, or devices used. Now compare those printed screenshots of baseline responses to the filtered data. Chances are you’ll see some significant differences in how each group responded to your questions, giving you clues about the variance in interests and motivations in customer segments and a leg up as you work on future design projects.
Open-ended responses are equally interesting, but much more time-consuming to analyze. Yes, you need to read through thousands of responses, some of which are constructive and some of which are not. Taking the time to tag each open response will help you see trends and filter out the responses that are unhelpful.
Unlike questions with predefined answers, open-ended responses let users express unique ideas and use cases you may not be looking for. The tedium of reading thousands of response is always cut by eureka moments when users tell you something fascinating that changes your perspective on your app. These are the folks you want to pull out for follow-up interviews. Because you’ve already captured their email addresses when you set up your survey and your email, getting in touch will be a piece of cake.
Filter, compare, interview, and summarize; then share your findings with your colleagues. Reports are great for head honchos, but if you want to really inform and inspire, create a video, a poster series, or even a comic to communicate what you’ve learned. Want to get really fancy? Store your survey results in a centrally accessible location so anyone in your company can research and discover the insights they need to make more informed designs.
Good design researchers discover valuable insights. Great design researchers turn those insights into stories.
Conclusion
As we enter the new year, it’s a great time to reflect on the work we’ve done in the past and how we can do better in the future. Without a doubt, designers working with a foundation of insights about customers can make more effective UIs. But designers aren’t the only ones who stand to gain from the data collected in an annual survey—anyone who makes things for or communicates with customers will find themselves empowered to do better work when they know more about the people they serve. The data you collect with your survey is a fantastic holiday gift to your colleagues, one that they’ll appreciate throughout the year.
About the author
Aarron Walter is the Director of User Experience at MailChimp, where he strives to make software more human. Aarron is the author of Designing for Emotion from A Book Apart. Aarron taught design at colleges in the US and Europe for nearly a decade, and speaks at conferences around the world. His design guidance has helped the White House, the US Department of State, and dozens of startups and venture capitalists. He tweets about design under the moniker @aarron on Twitter.
Brought to you by

Related articles
-
Art Direction and the New WordPress Editor
Mel Choyce explores how the new WordPress editor (also know as Gutenberg) can be used to create more carefully art directed posts. Like gifts carefully arranged beneath the Christmas tree, it’s the contents that matters but the presentation that sells.
-
Be the Villain
Eric Bailey asks us to take on the role of King Herod in our projects to consider how the products, services and processes we design could be abused to cause harm rather than to do good. No matter how good our intentions, we must remember that not every user has pure motivations and that every tool is a weapon if you hold it right.
-
Creating a Weekly Research Cadence
Wren Lanier sets aside time to explore the benefits of a regular schedule for user research. Santa’s elves quickly discovered the benefits of working to a fixed schedule, which is of course why we don’t get presents at Easter.
-
How to Do a UX Review
Joe Leech offers a rundown on his UX review process, sharing tips about analysing data and creating personas, and setting out findings in a form that benefits clients. From quick wins to workshops, there are gifts here everyone will be grateful for.
-
How to Use Audio on the Web
Ruth John lets the bells ring out for Christmas with a look at a selection of inspiring sites with creative and effective use of audio. The days of jangly MIDI tunes to distract and annoy are thankfully long behind us, with browser APIs offering new and exciting ways to generate sound. Ahead is a beautiful sonic landscape. Ding dong!
-
What I Learned about Product Design This Year
Meagan Fisher casts a thoughtful glance back over her work this year and considers what it means to design a product rather than a marketing experience. Pour yourself a cup of eggnog, grab a mince pie or two and gather around the fireside. Are you sitting comfortably? Good, then we shall begin.